Audio Spectrum Explained

Audio Spectrum Explained for Beginners – episode 6 of BIGZUN Modular Academy, a free step-by-step video course about sound, synthesis and modular synthesizers. Made for beginners, no experience needed.
Welcome to Bigzun Modular Academy, for beginners. A spectrum lets us see the frequency ingredients of a sound. Today, we will learn to read it. A spectrum places frequency on the horizontal axis. Higher positions on the vertical axis indicate stronger components. Always check the units and scale before comparing measurements.
Chapters
- Reading a Spectrum
- Start with the axes
- A sine makes one main peak
- Harmonics make a pattern
- Different waveforms, different spectra
- Resolution takes time
- Linear and logarithmic frequency scales
- Watch a filter change the spectrum
- Noise fills a broad region
- Combine components with BIGZUN MIX3
- Try it: listen, then look
- A spectrum shows frequency ingredients
Lesson notes
Reading a Spectrum
Welcome to BIGZUN Modular Academy, for beginners. A spectrum lets us see the frequency ingredients of a sound. Today, we will learn to read it.
Start with the axes
A spectrum places frequency on the horizontal axis. Higher positions on the vertical axis indicate stronger components. Always check the units and scale before comparing measurements.
A sine makes one main peak
An ideal sine contains a single frequency. Our example gives one main peak at two hundred twenty hertz. A real analyzer may spread that peak across nearby bins.
Harmonics make a pattern
Add components at twice and three times the fundamental. The peaks form a harmonic pattern. Their positions show the frequencies; their heights show their relative strengths.
Different waveforms, different spectra
A sine has one component. A triangle has weaker odd harmonics. A sawtooth has both even and odd harmonics. Listen as extra components change the sound.
Resolution takes time
An analyzer measures a finite section of audio. A longer window can distinguish closer frequencies, but responds more slowly to changes. A short window offers better timing detail.
Linear and logarithmic frequency scales
On a linear axis, equal distances mean equal frequency differences. On a logarithmic axis, equal distances can represent equal ratios, such as the doubling of an octave.
Watch a filter change the spectrum
A low pass filter reduces higher components. The spectrum becomes less bright at the top, while the fundamental can remain prominent. Compare this sawtooth before and after filtering.
Noise fills a broad region
Noise contains energy across many frequencies. Its spectrum does not look like a tidy series of harmonic lines. Averaging helps reveal its overall shape through the fluctuations.
Combine components with BIGZUN MIX3
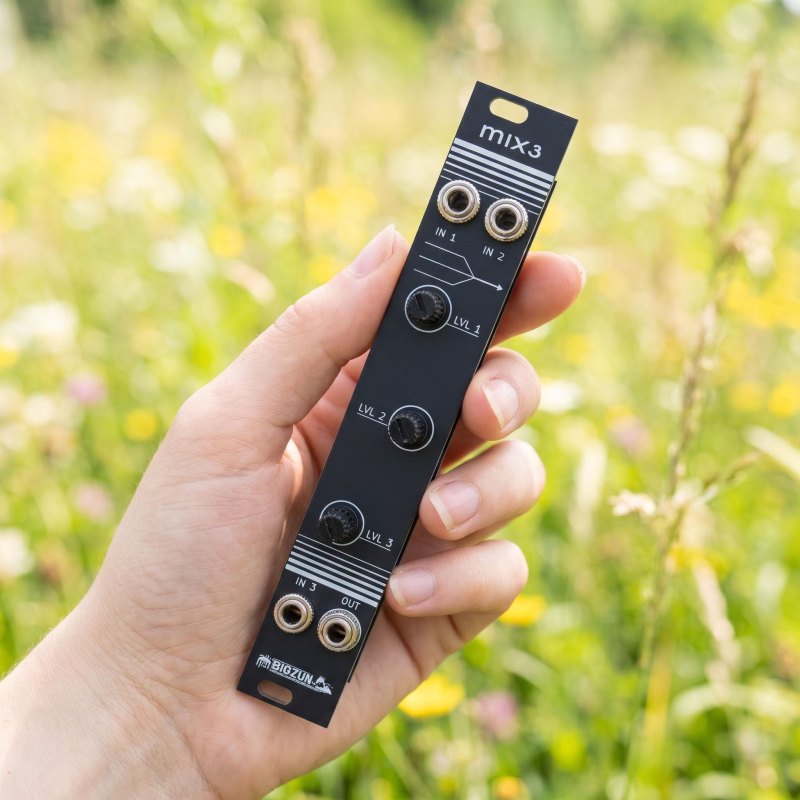
Three sine sources and a mixer make a useful experiment. Change one input level, and the corresponding spectral peak changes. The BIGZUN MIX three provides separate input level controls.
Try it: listen, then look
First listen to a sine and a sawtooth at similar levels. Guess which spectrum has more upper components. Then use an analyzer to check your prediction.
A spectrum shows frequency ingredients
Remember the axes, look for the fundamental, and compare the balance of upper components. A spectrum supports your ears; it does not replace listening. Next, phase and polarity.